project tags: b2b software, product design, data visualization.
The application visualizes extensive data to aid Medical Officers in investigating diseases and medical issues across entire units or bases.
Designed with guidance from Yair Ronen & Einat Sharon, in 2024 for Advanced Product Design and Data Viz Design courses at Shenkar College.
![]()
Main Dashboard design
![]()
User journey table
![]()
User flow map
From wireframes to design
![]()
Final Design Iteration of Meeting table screen design
![]()
All Investigations screen design
![]()
Doctor-patient summary screen design
![]()
Start of Data Visualization Design Integration
![]()
1st Data Visualization Design Iteration
![]()
2nd Data Visualization Design Iteration
![]()
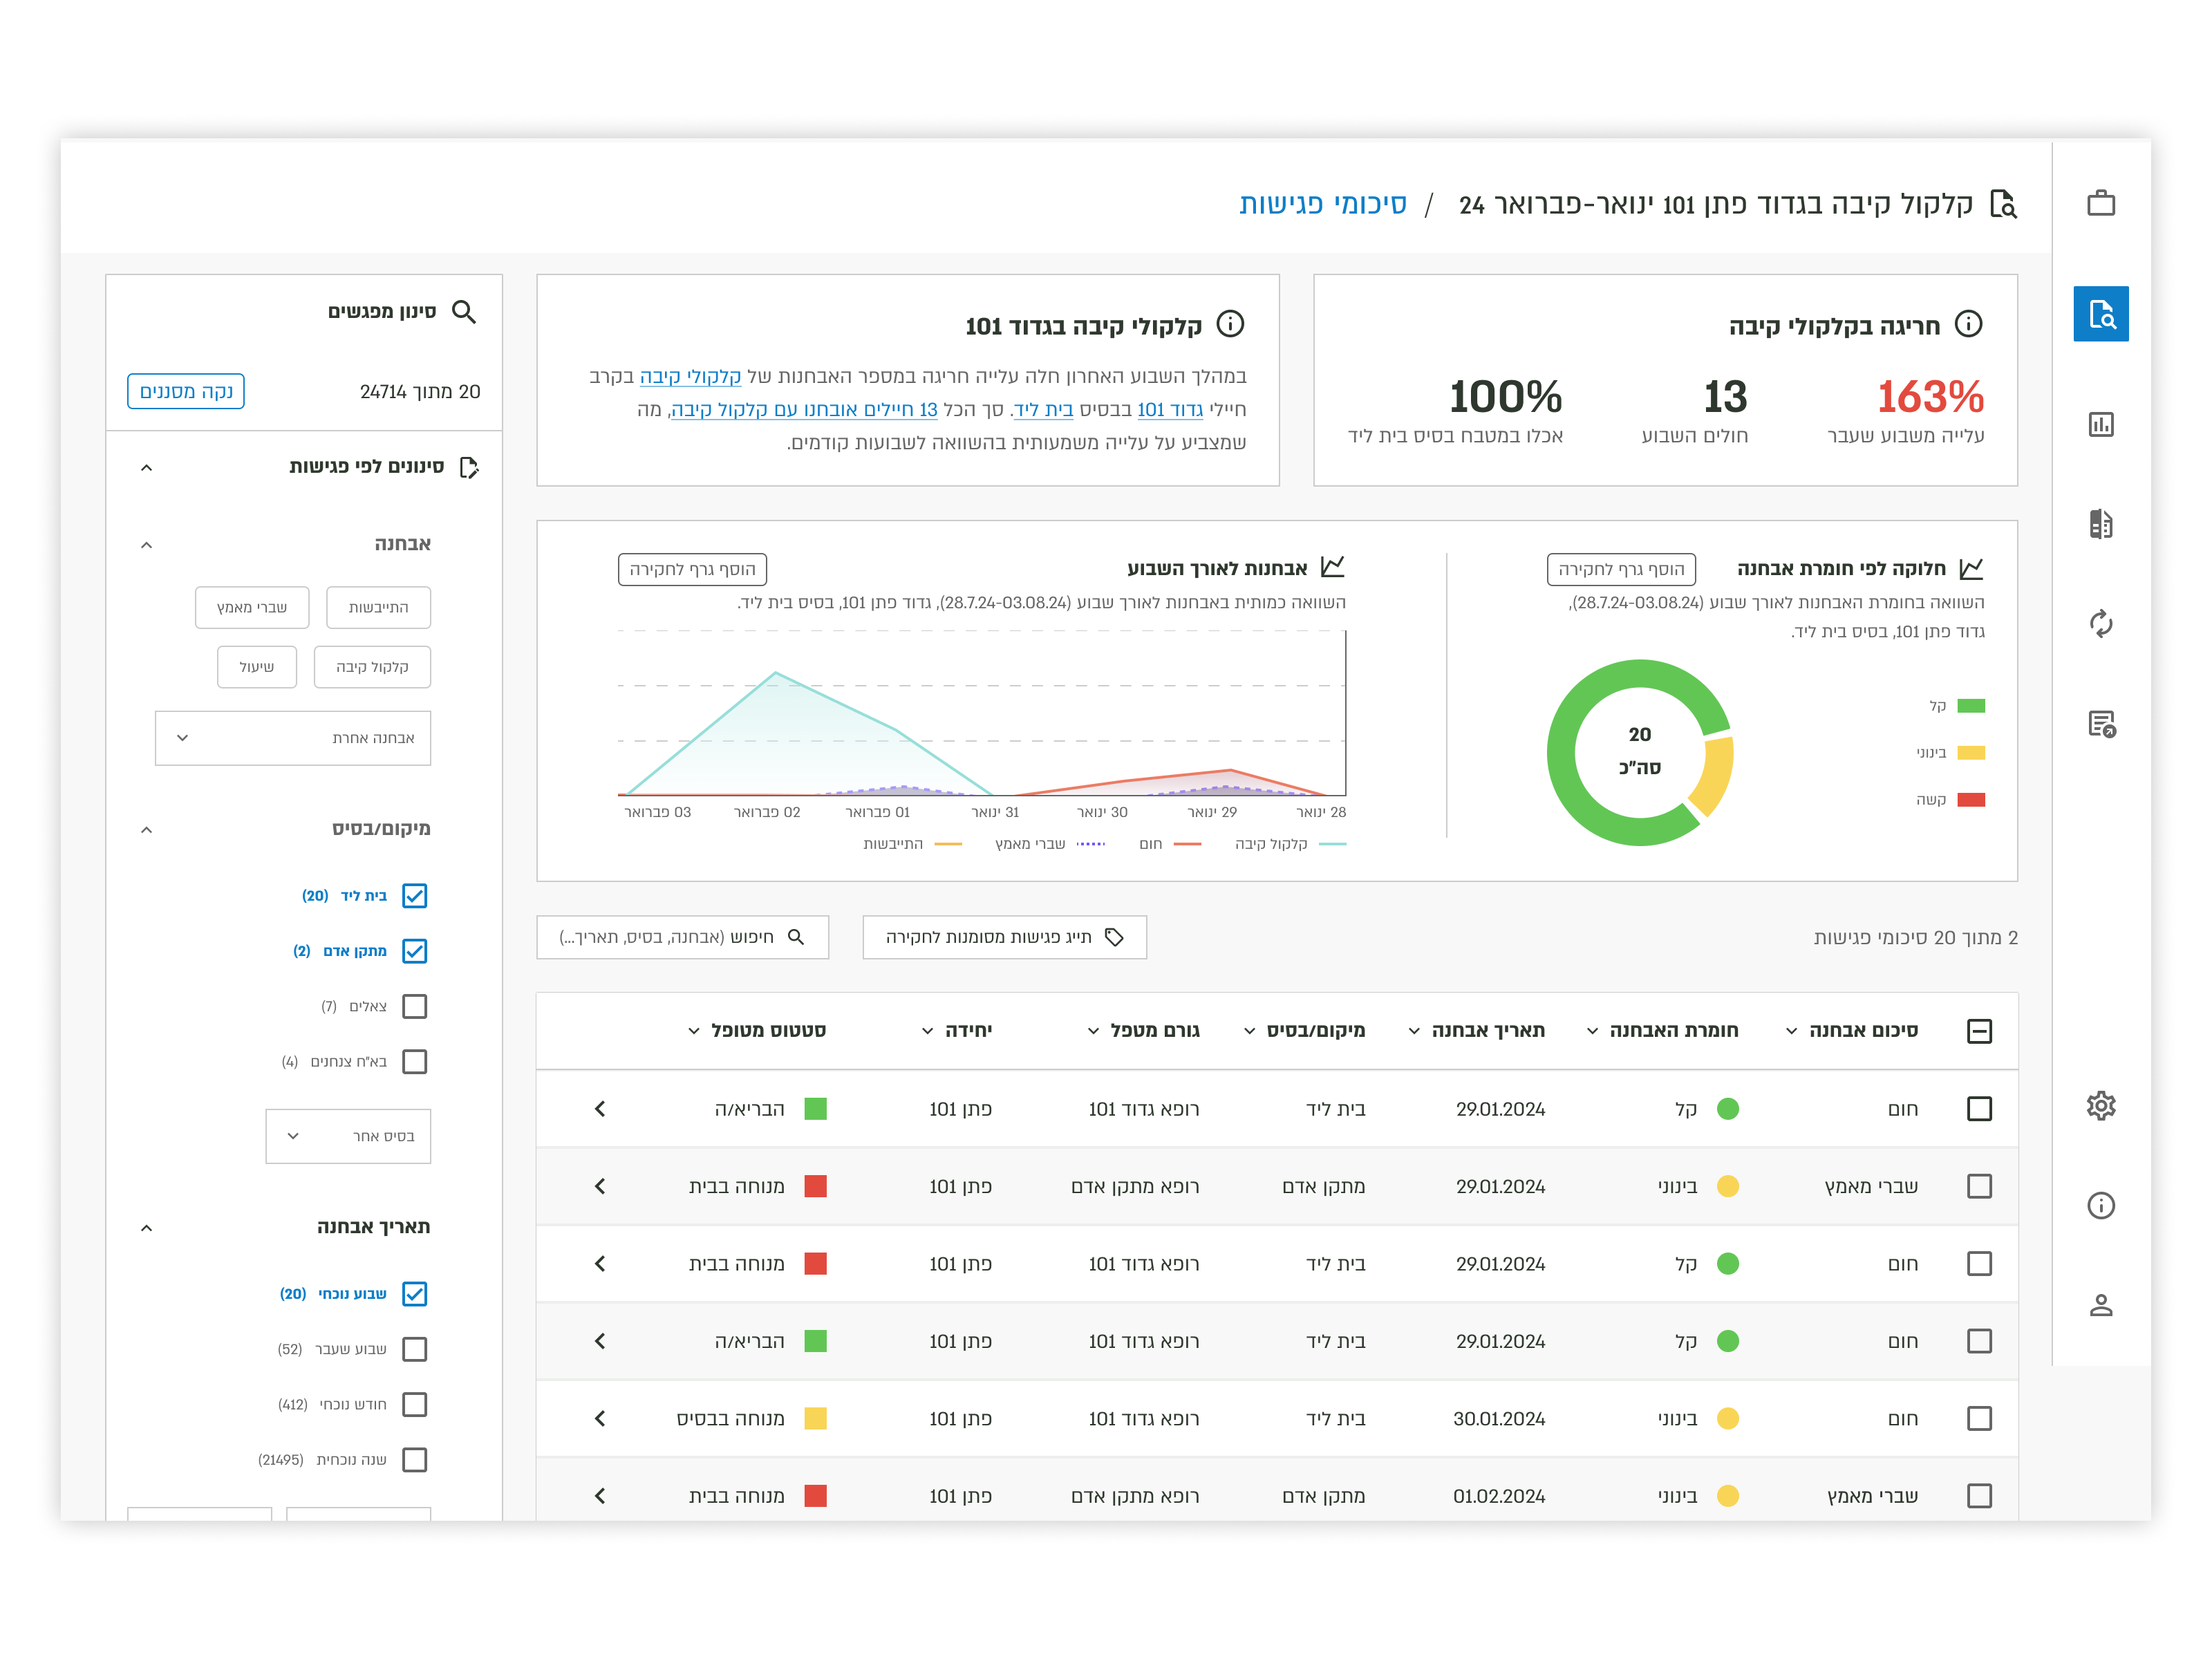
3rd Data Visualization Design Iteration
![]()
Visual Assets and Graphs Across Various Data Sets
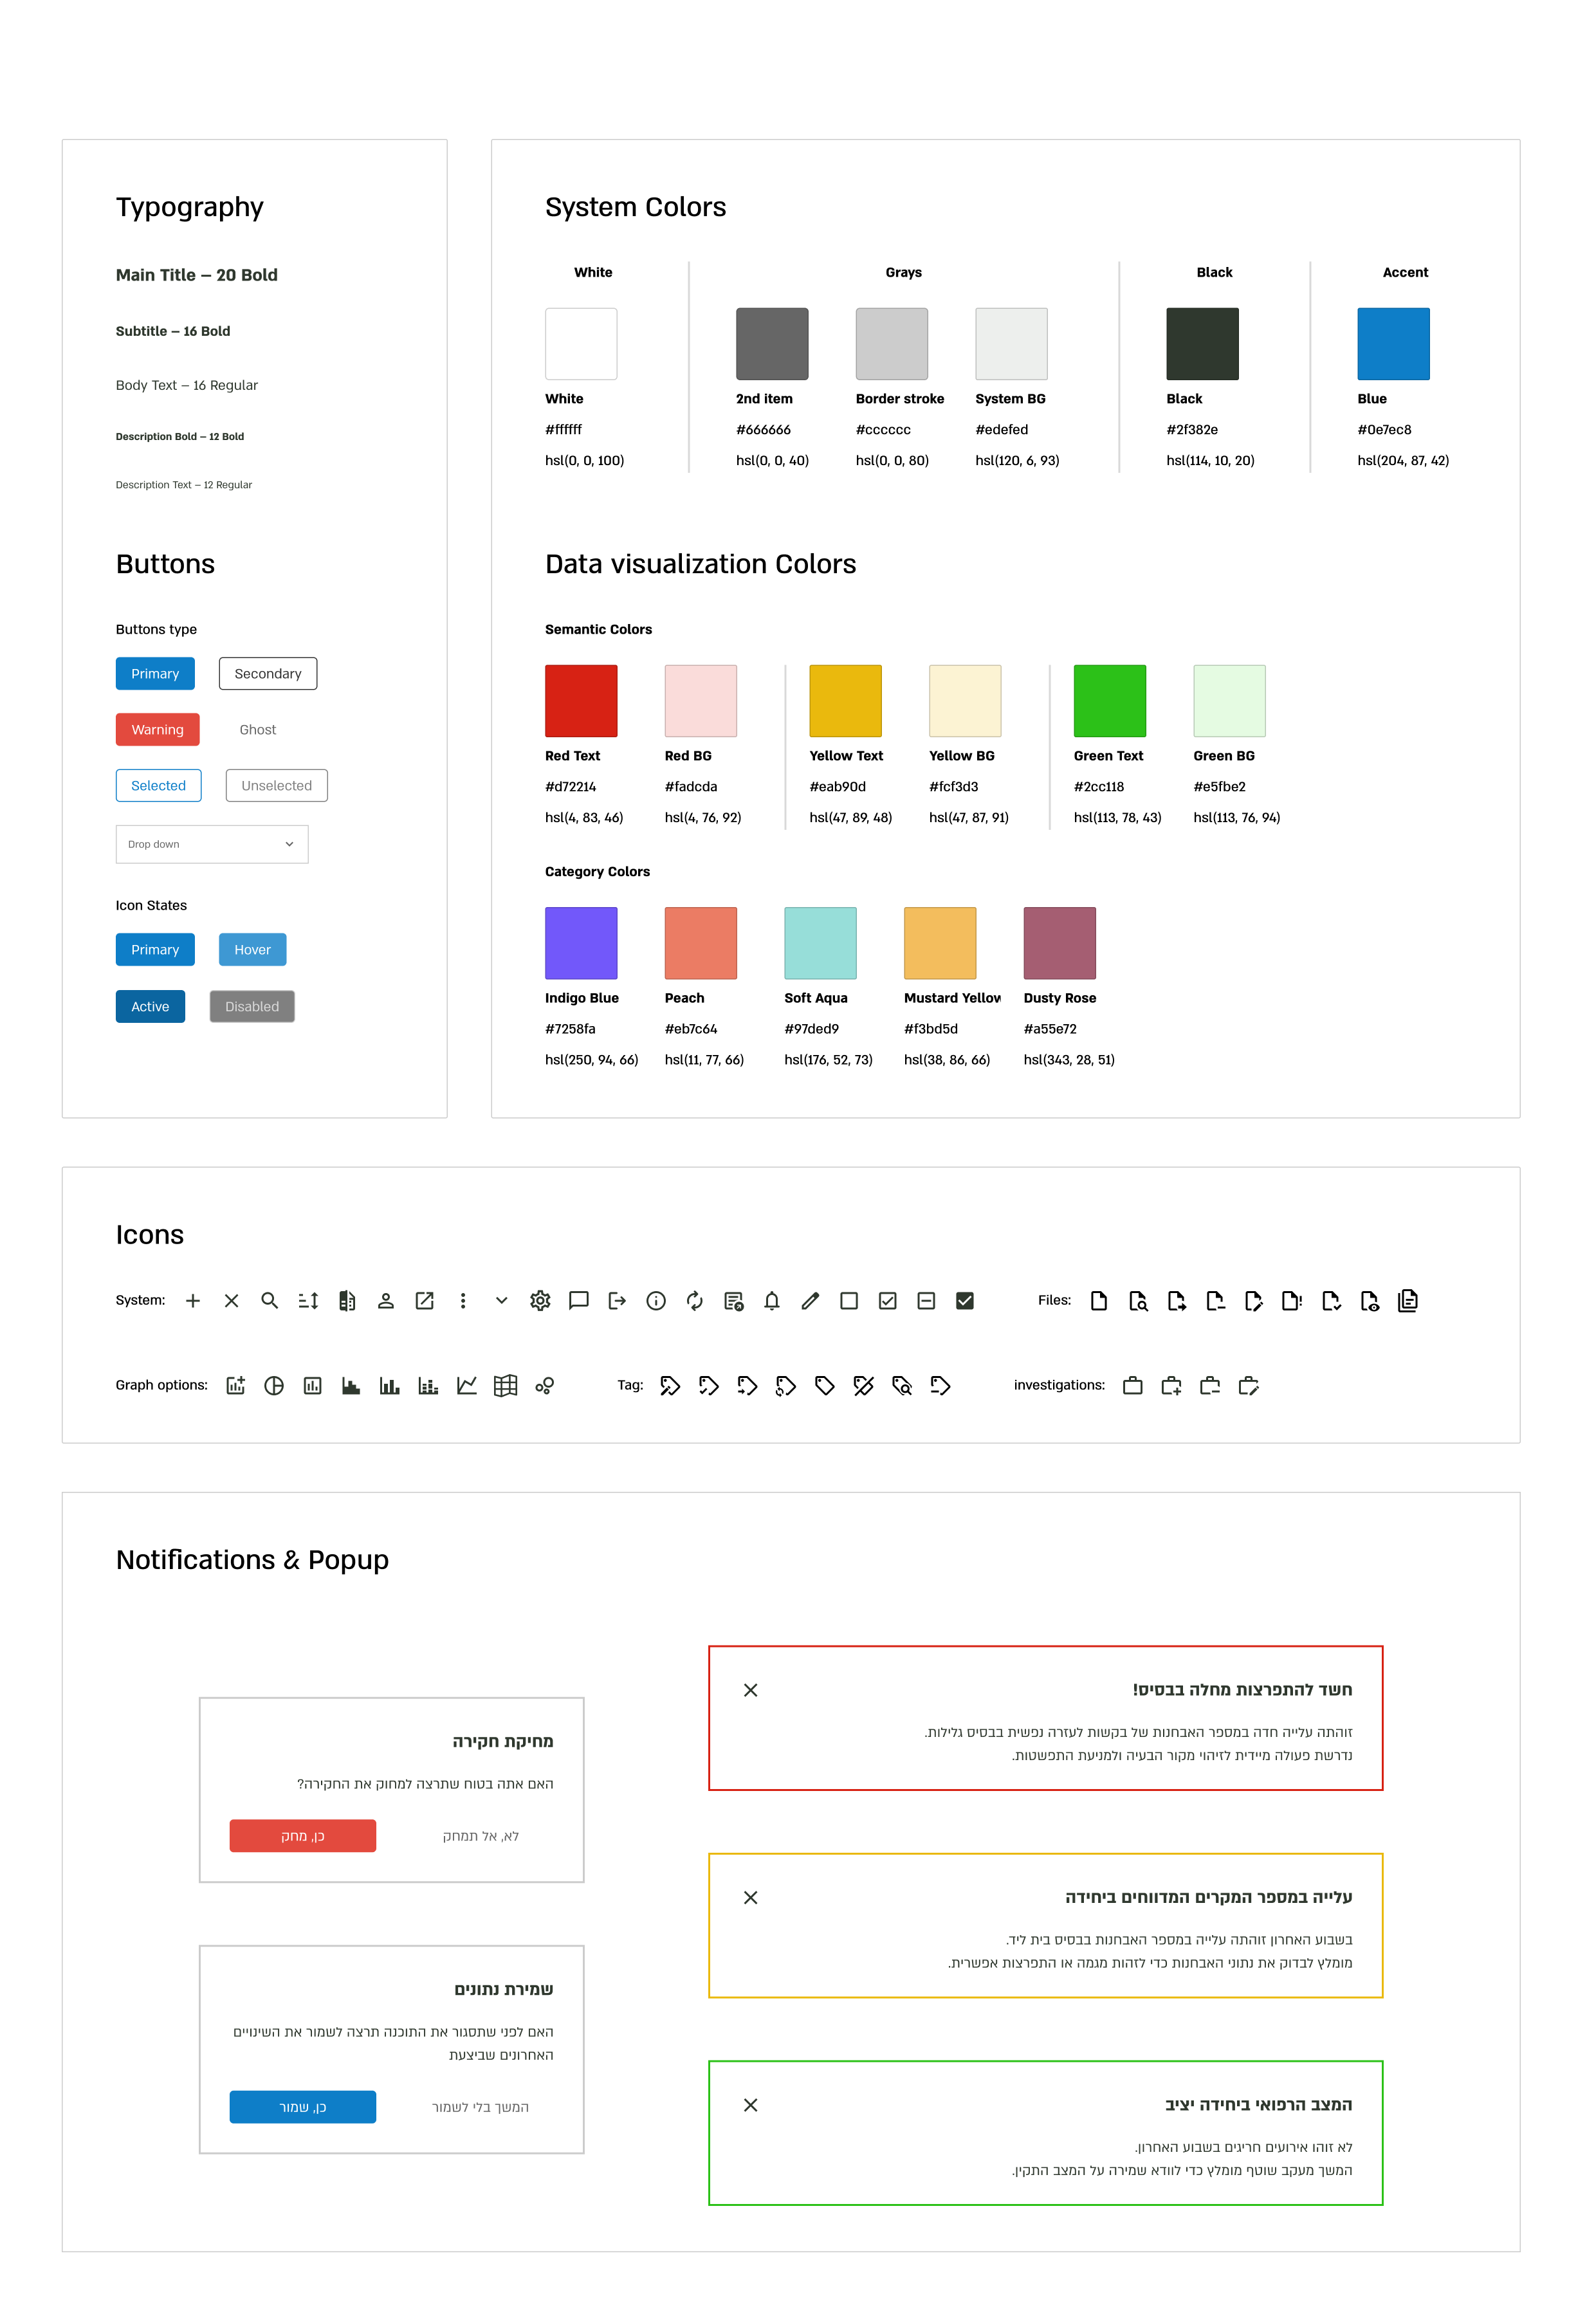
![]() Design system
Design system
Overview:
Megama is a Epidemiology Web-software for medical officers in the IDF.The application visualizes extensive data to aid Medical Officers in investigating diseases and medical issues across entire units or bases.
Designed with guidance from Yair Ronen & Einat Sharon, in 2024 for Advanced Product Design and Data Viz Design courses at Shenkar College.
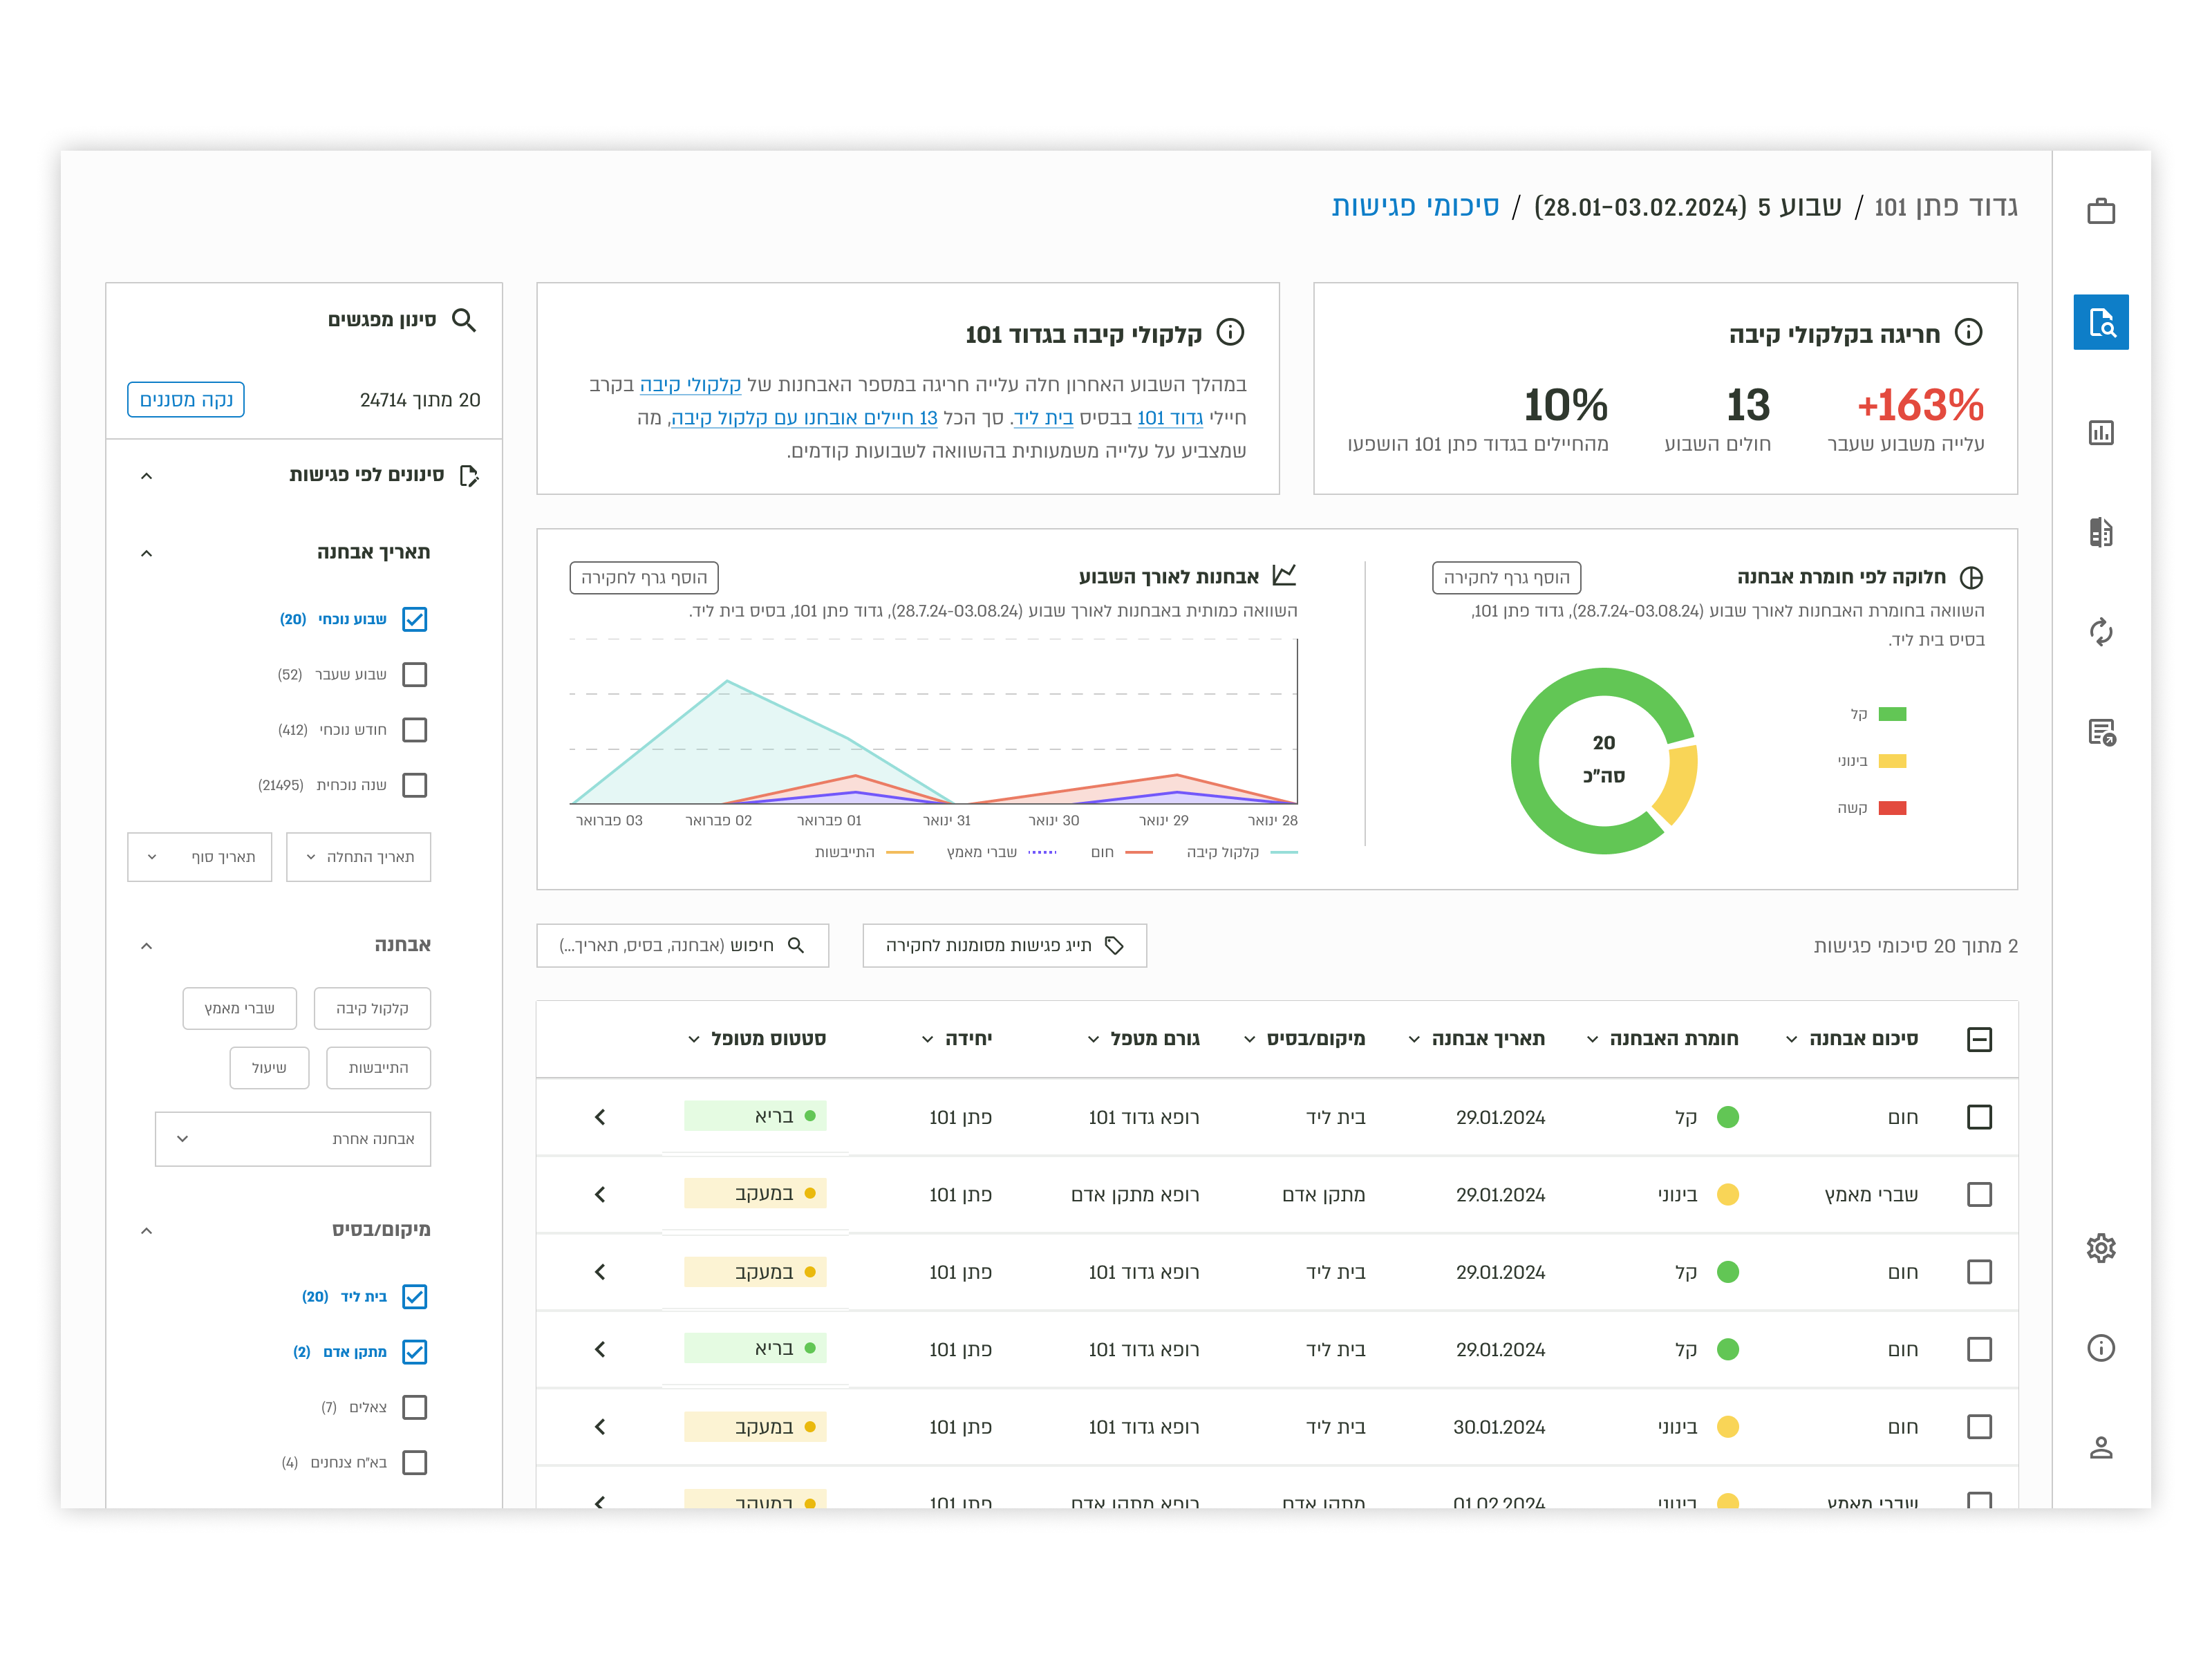
Main Dashboard design
Research:
To define the user journey in the most effective way, I conducted research by consulting with clinic managers, military doctors, developers from IDF Medical Corps development teams, and analysts from an existing BI team supporting the Medical Corps.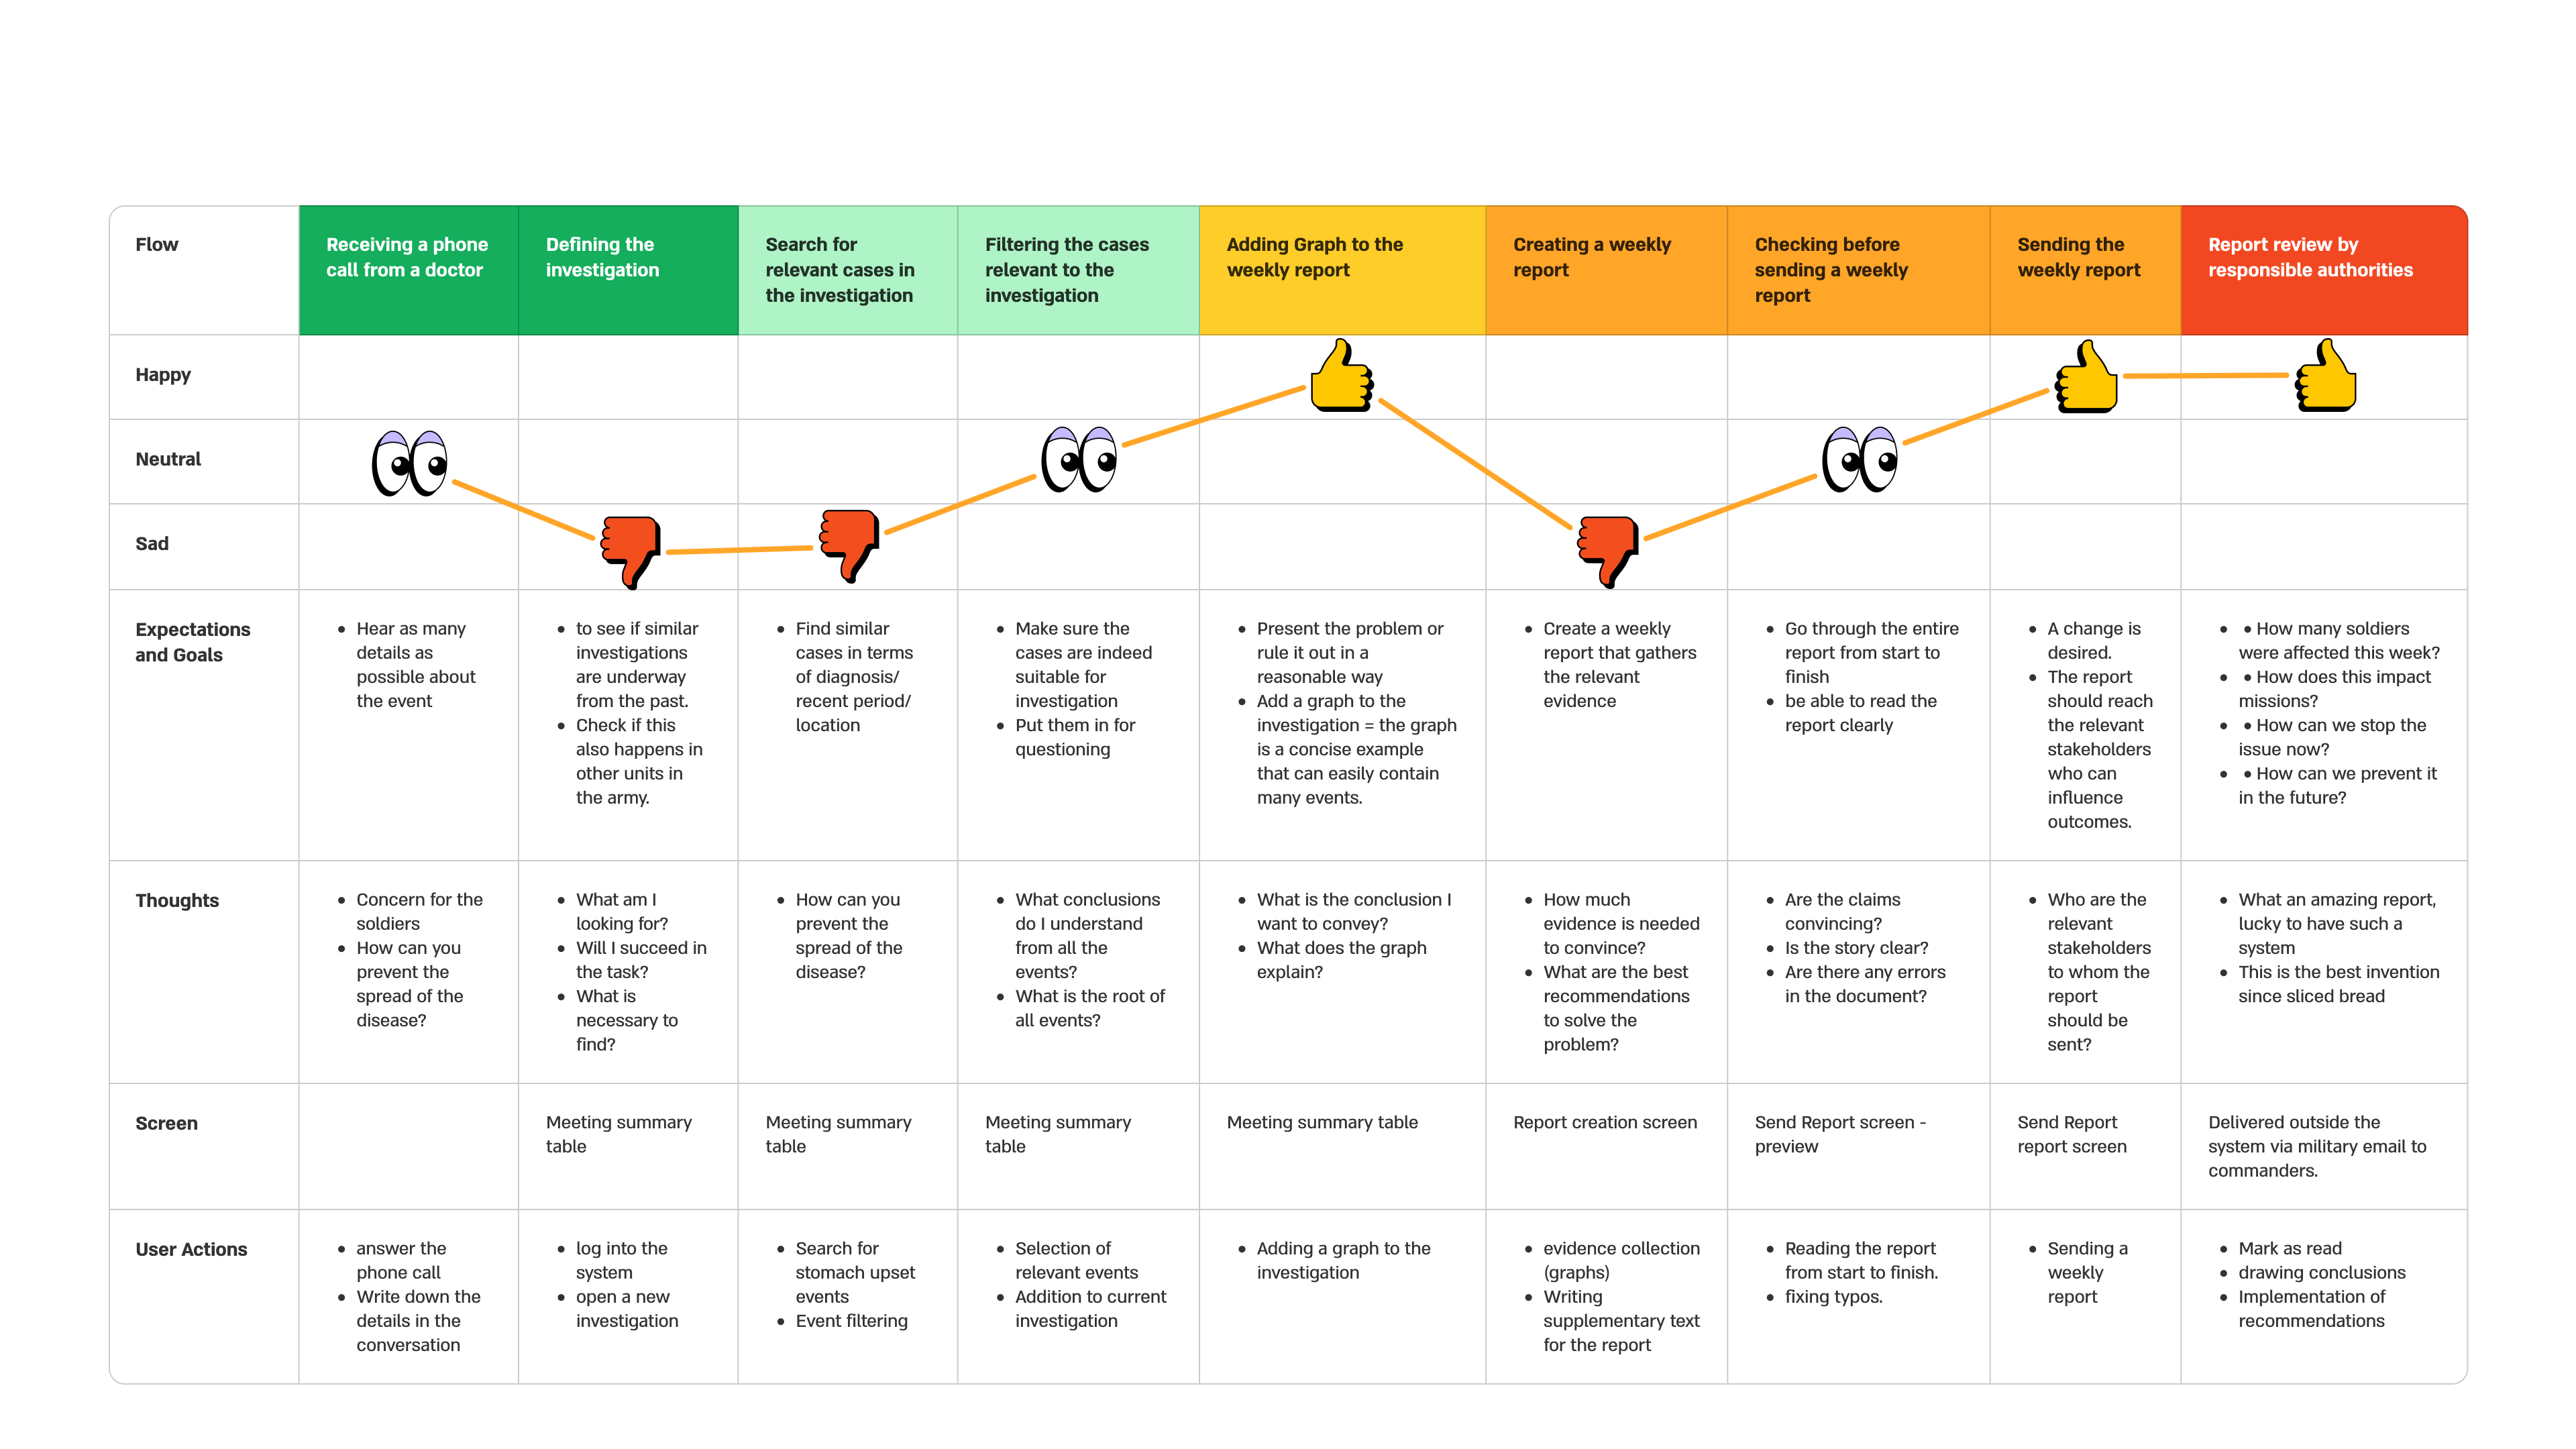
User journey table
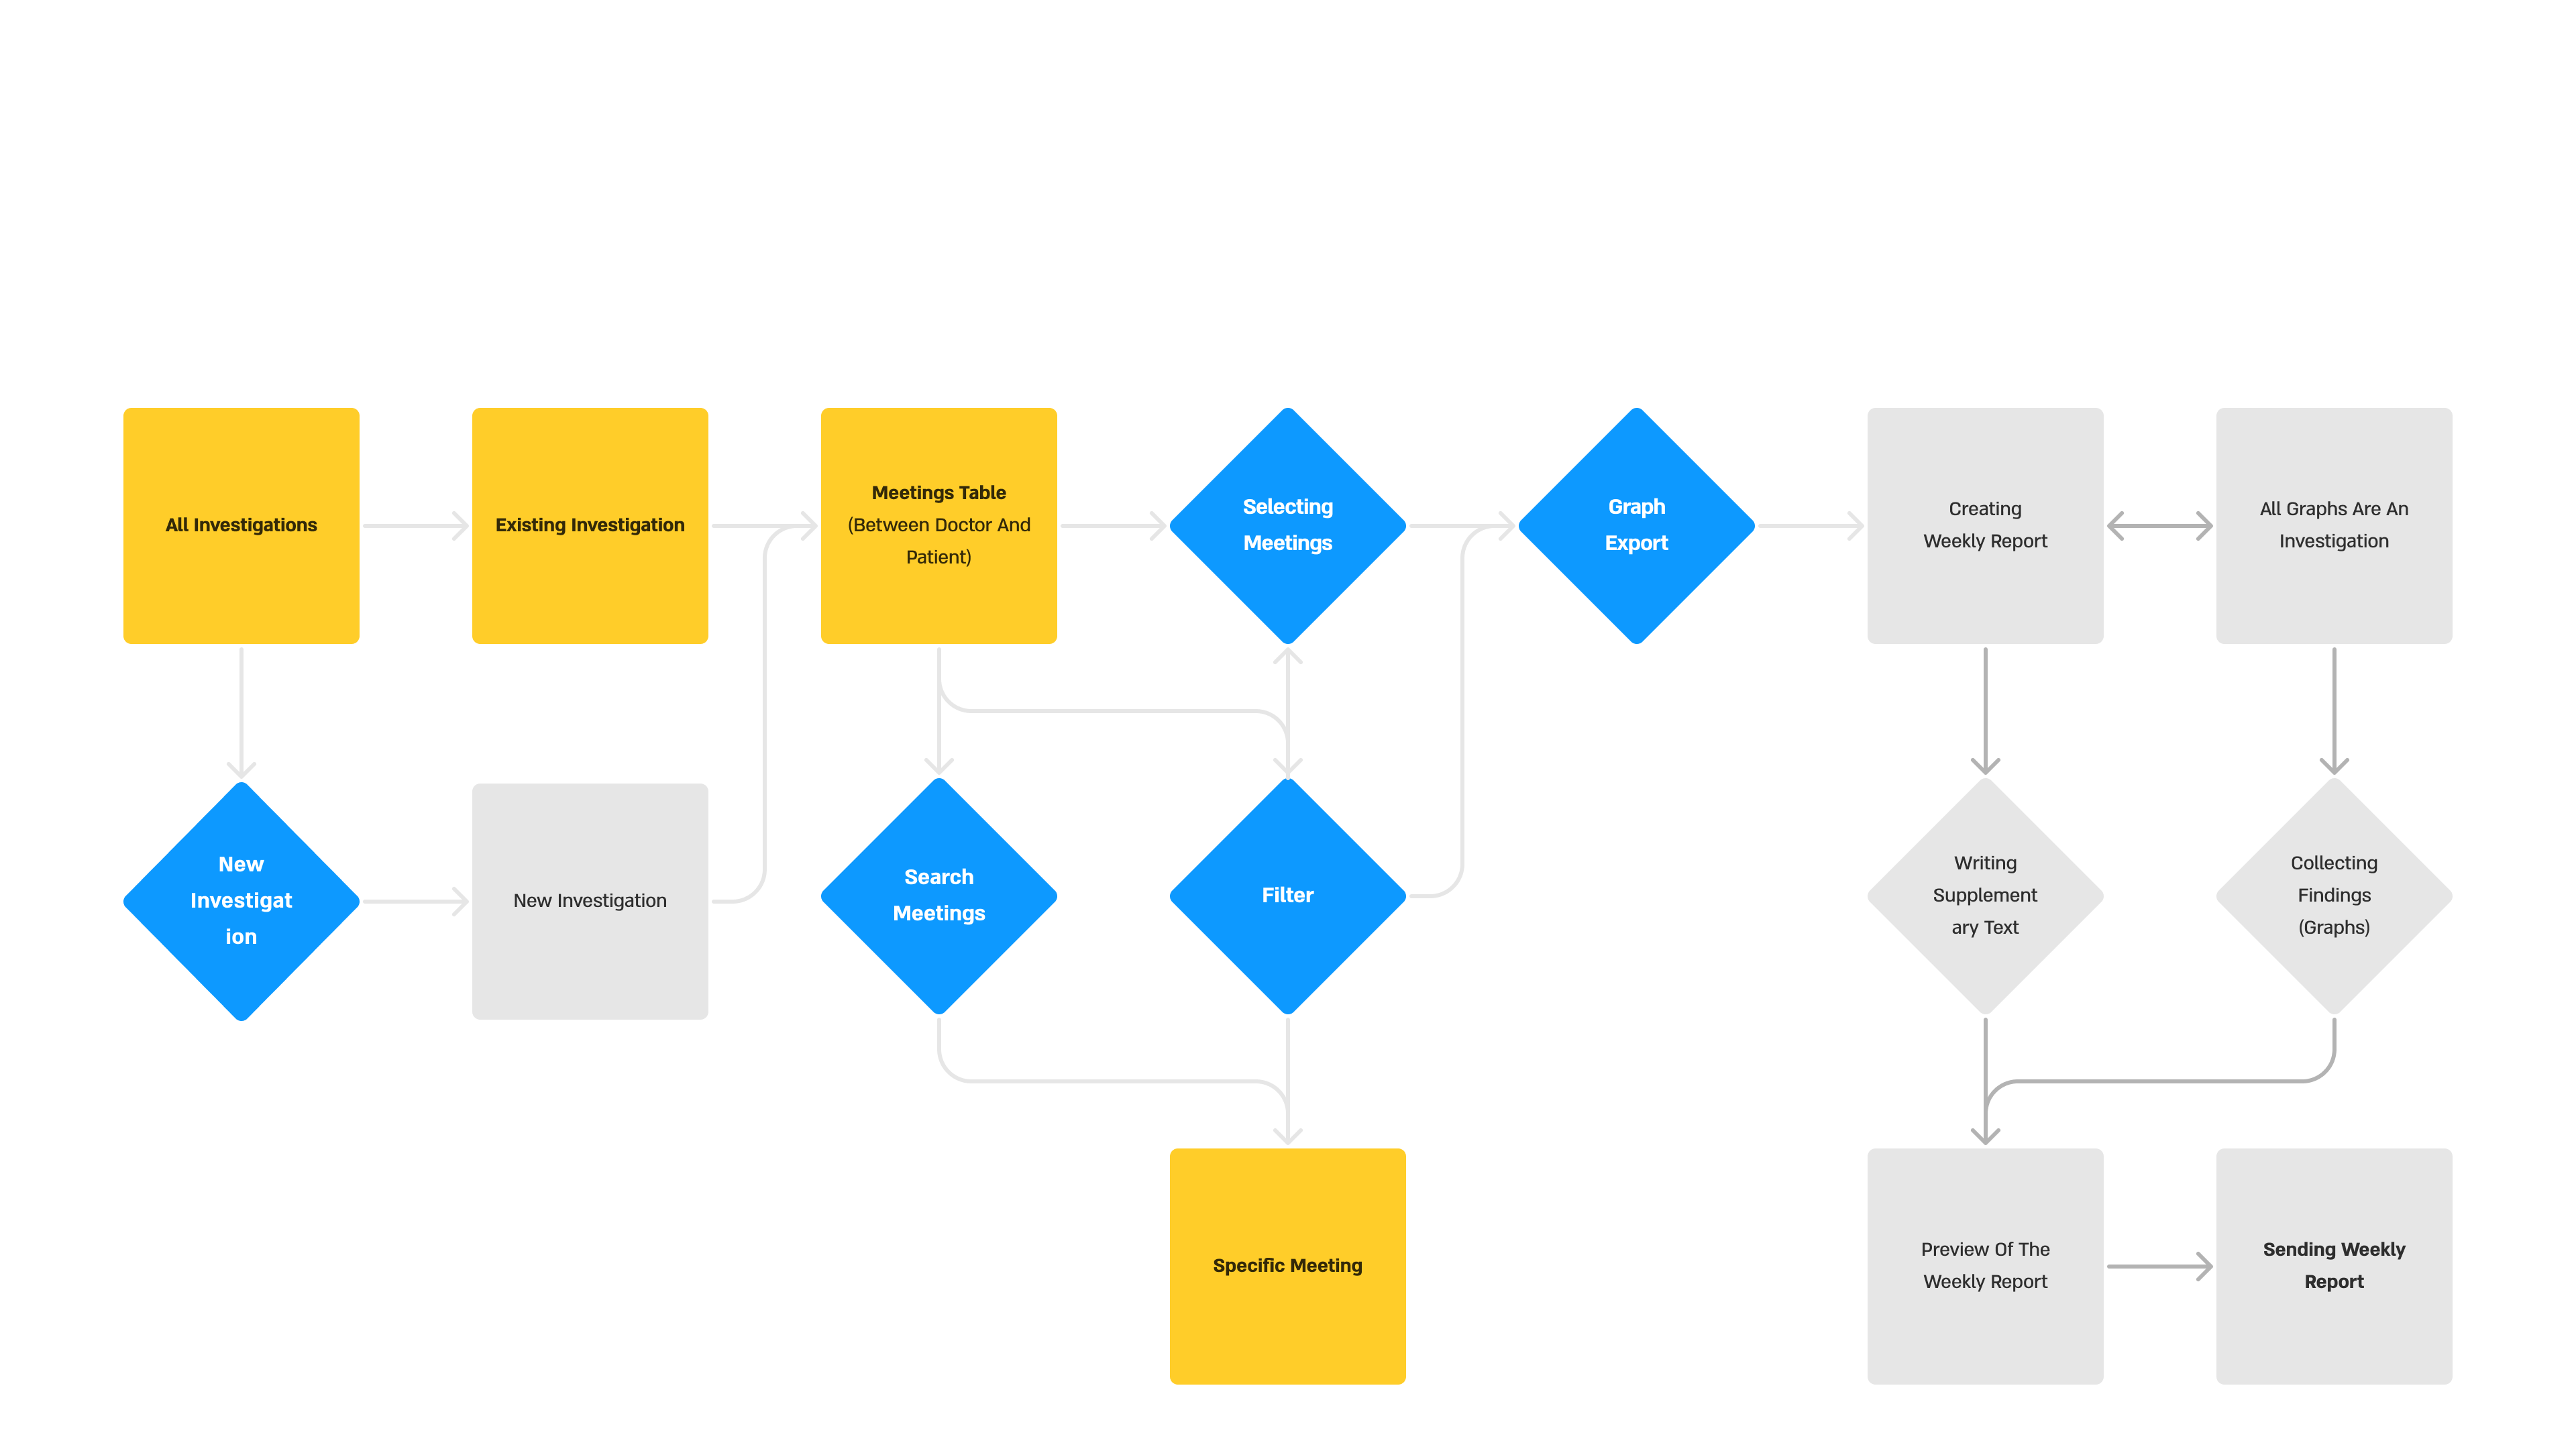
User flow map
Design Process:
From wireframes to design
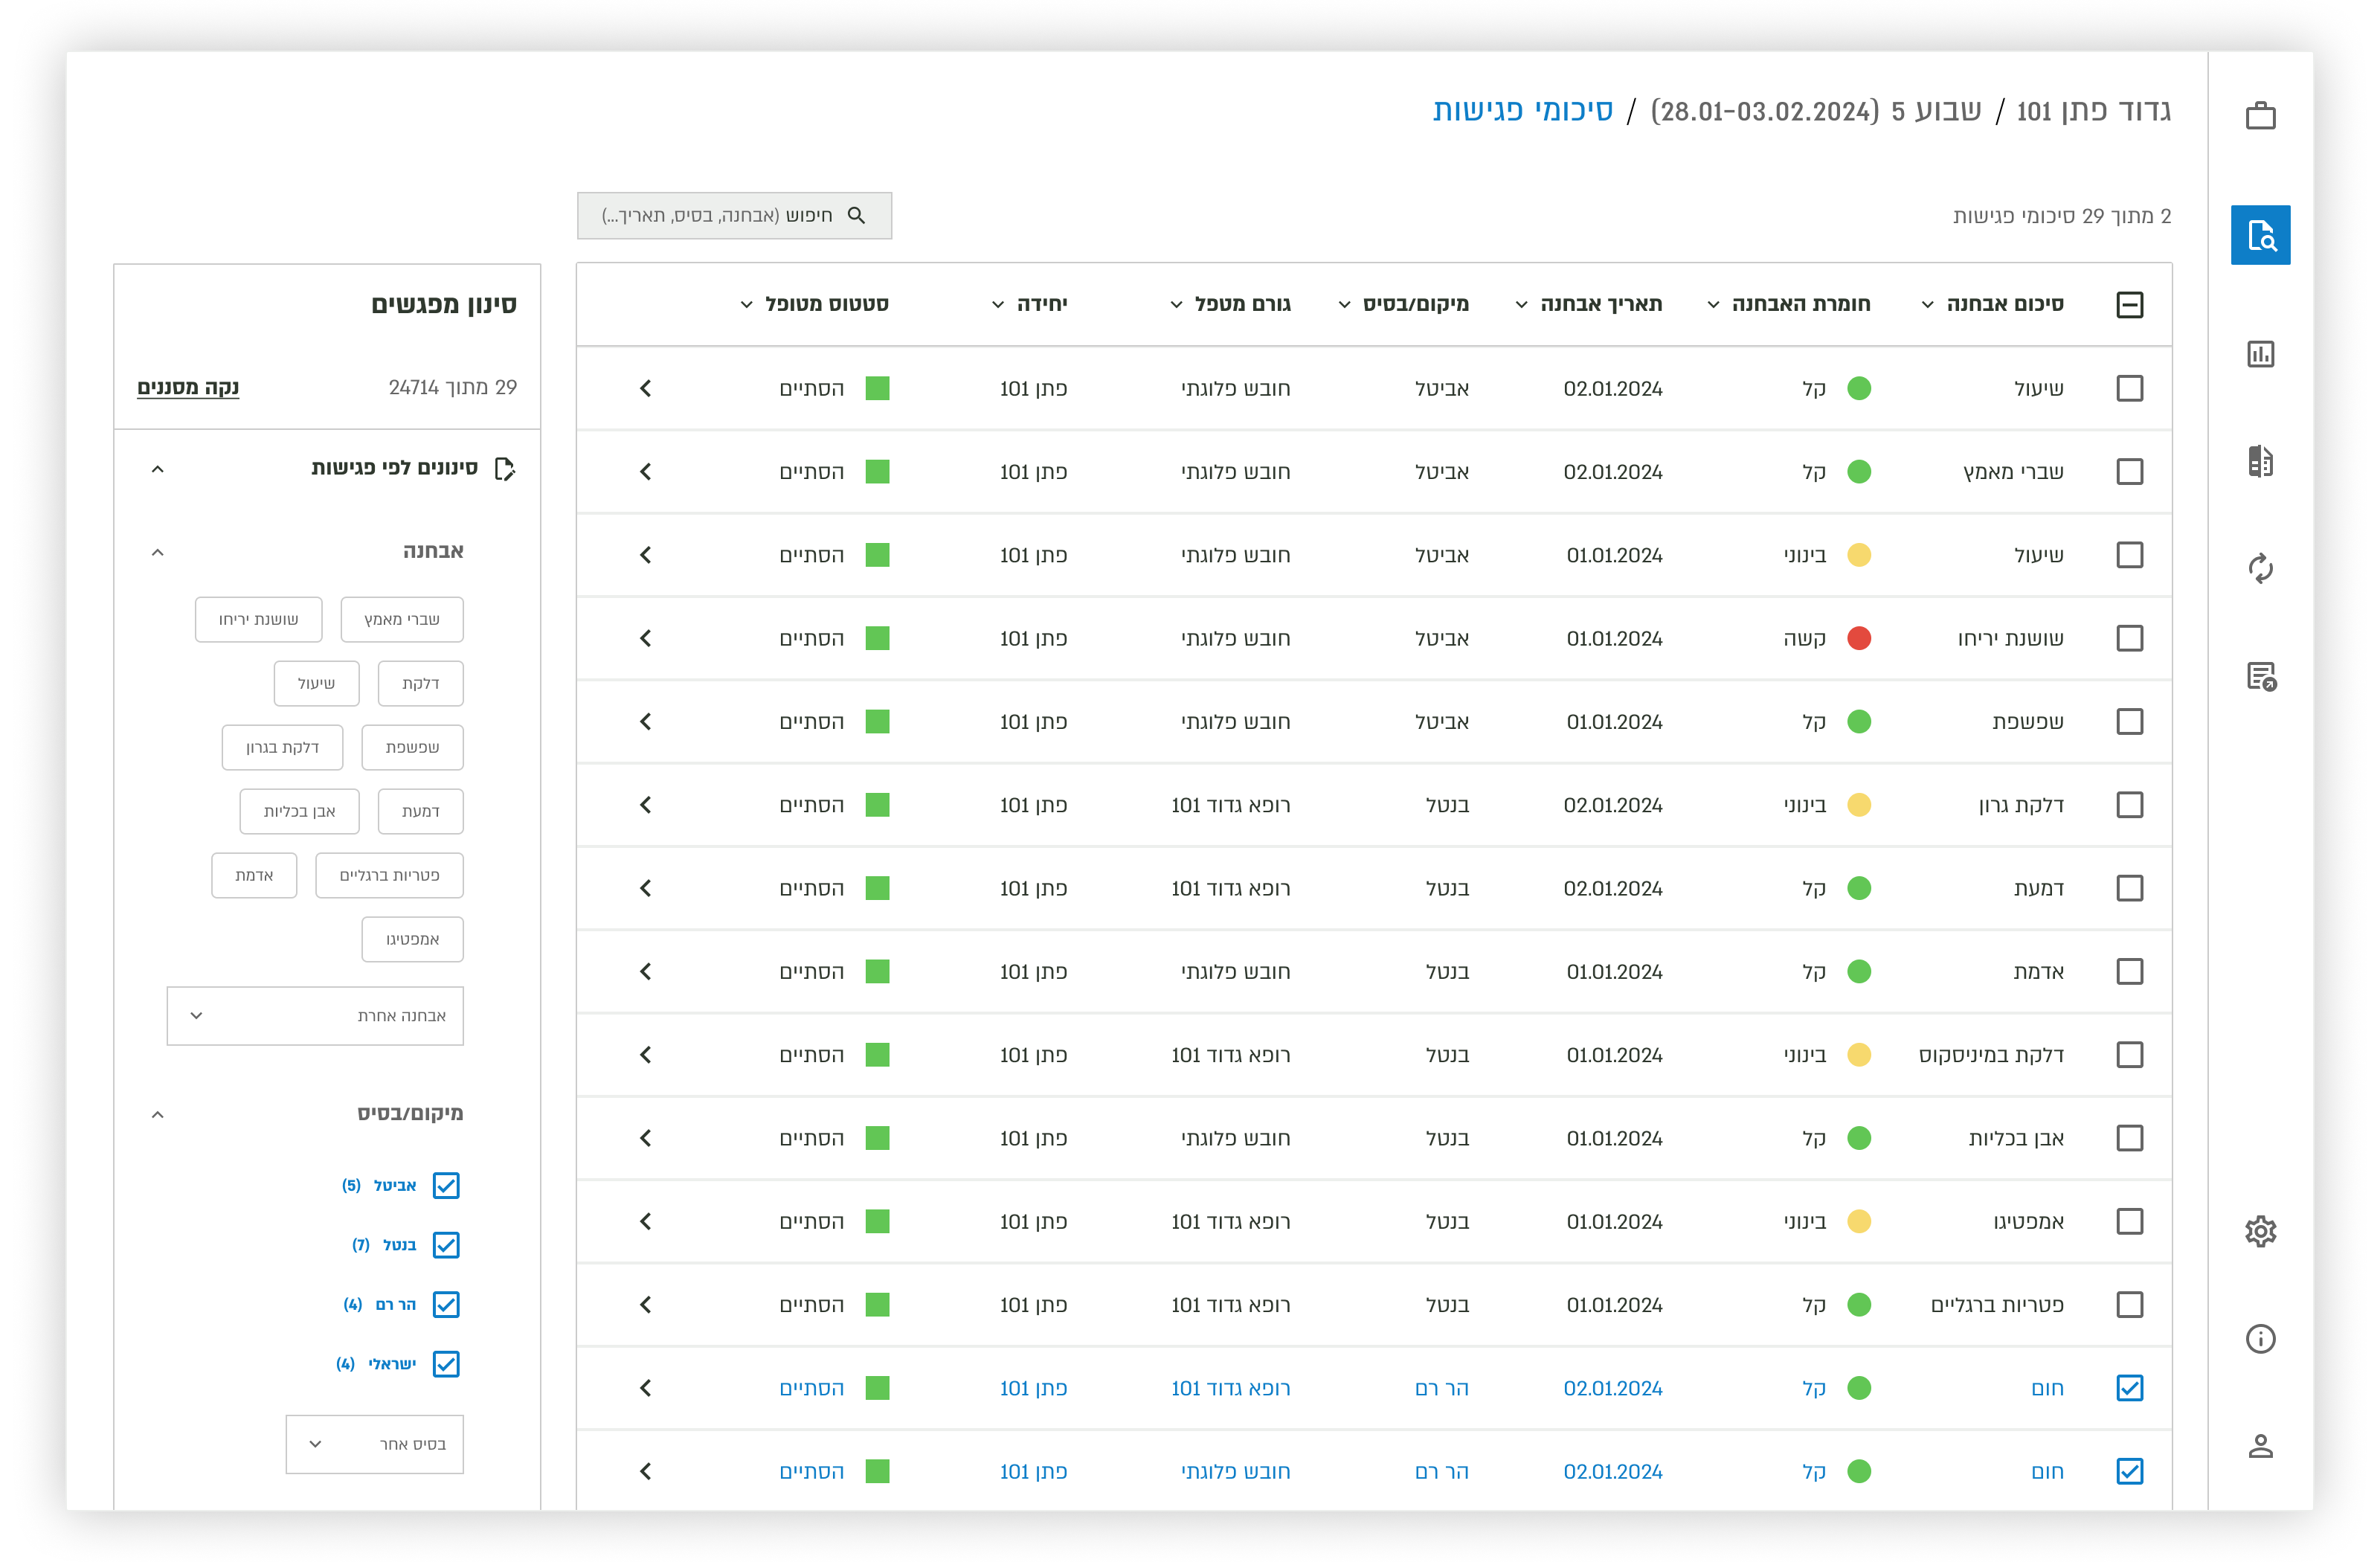
Final Design Iteration of Meeting table screen design

All Investigations screen design

Doctor-patient summary screen design
Data Visualization:

Start of Data Visualization Design Integration

1st Data Visualization Design Iteration
2nd Data Visualization Design Iteration
3rd Data Visualization Design Iteration
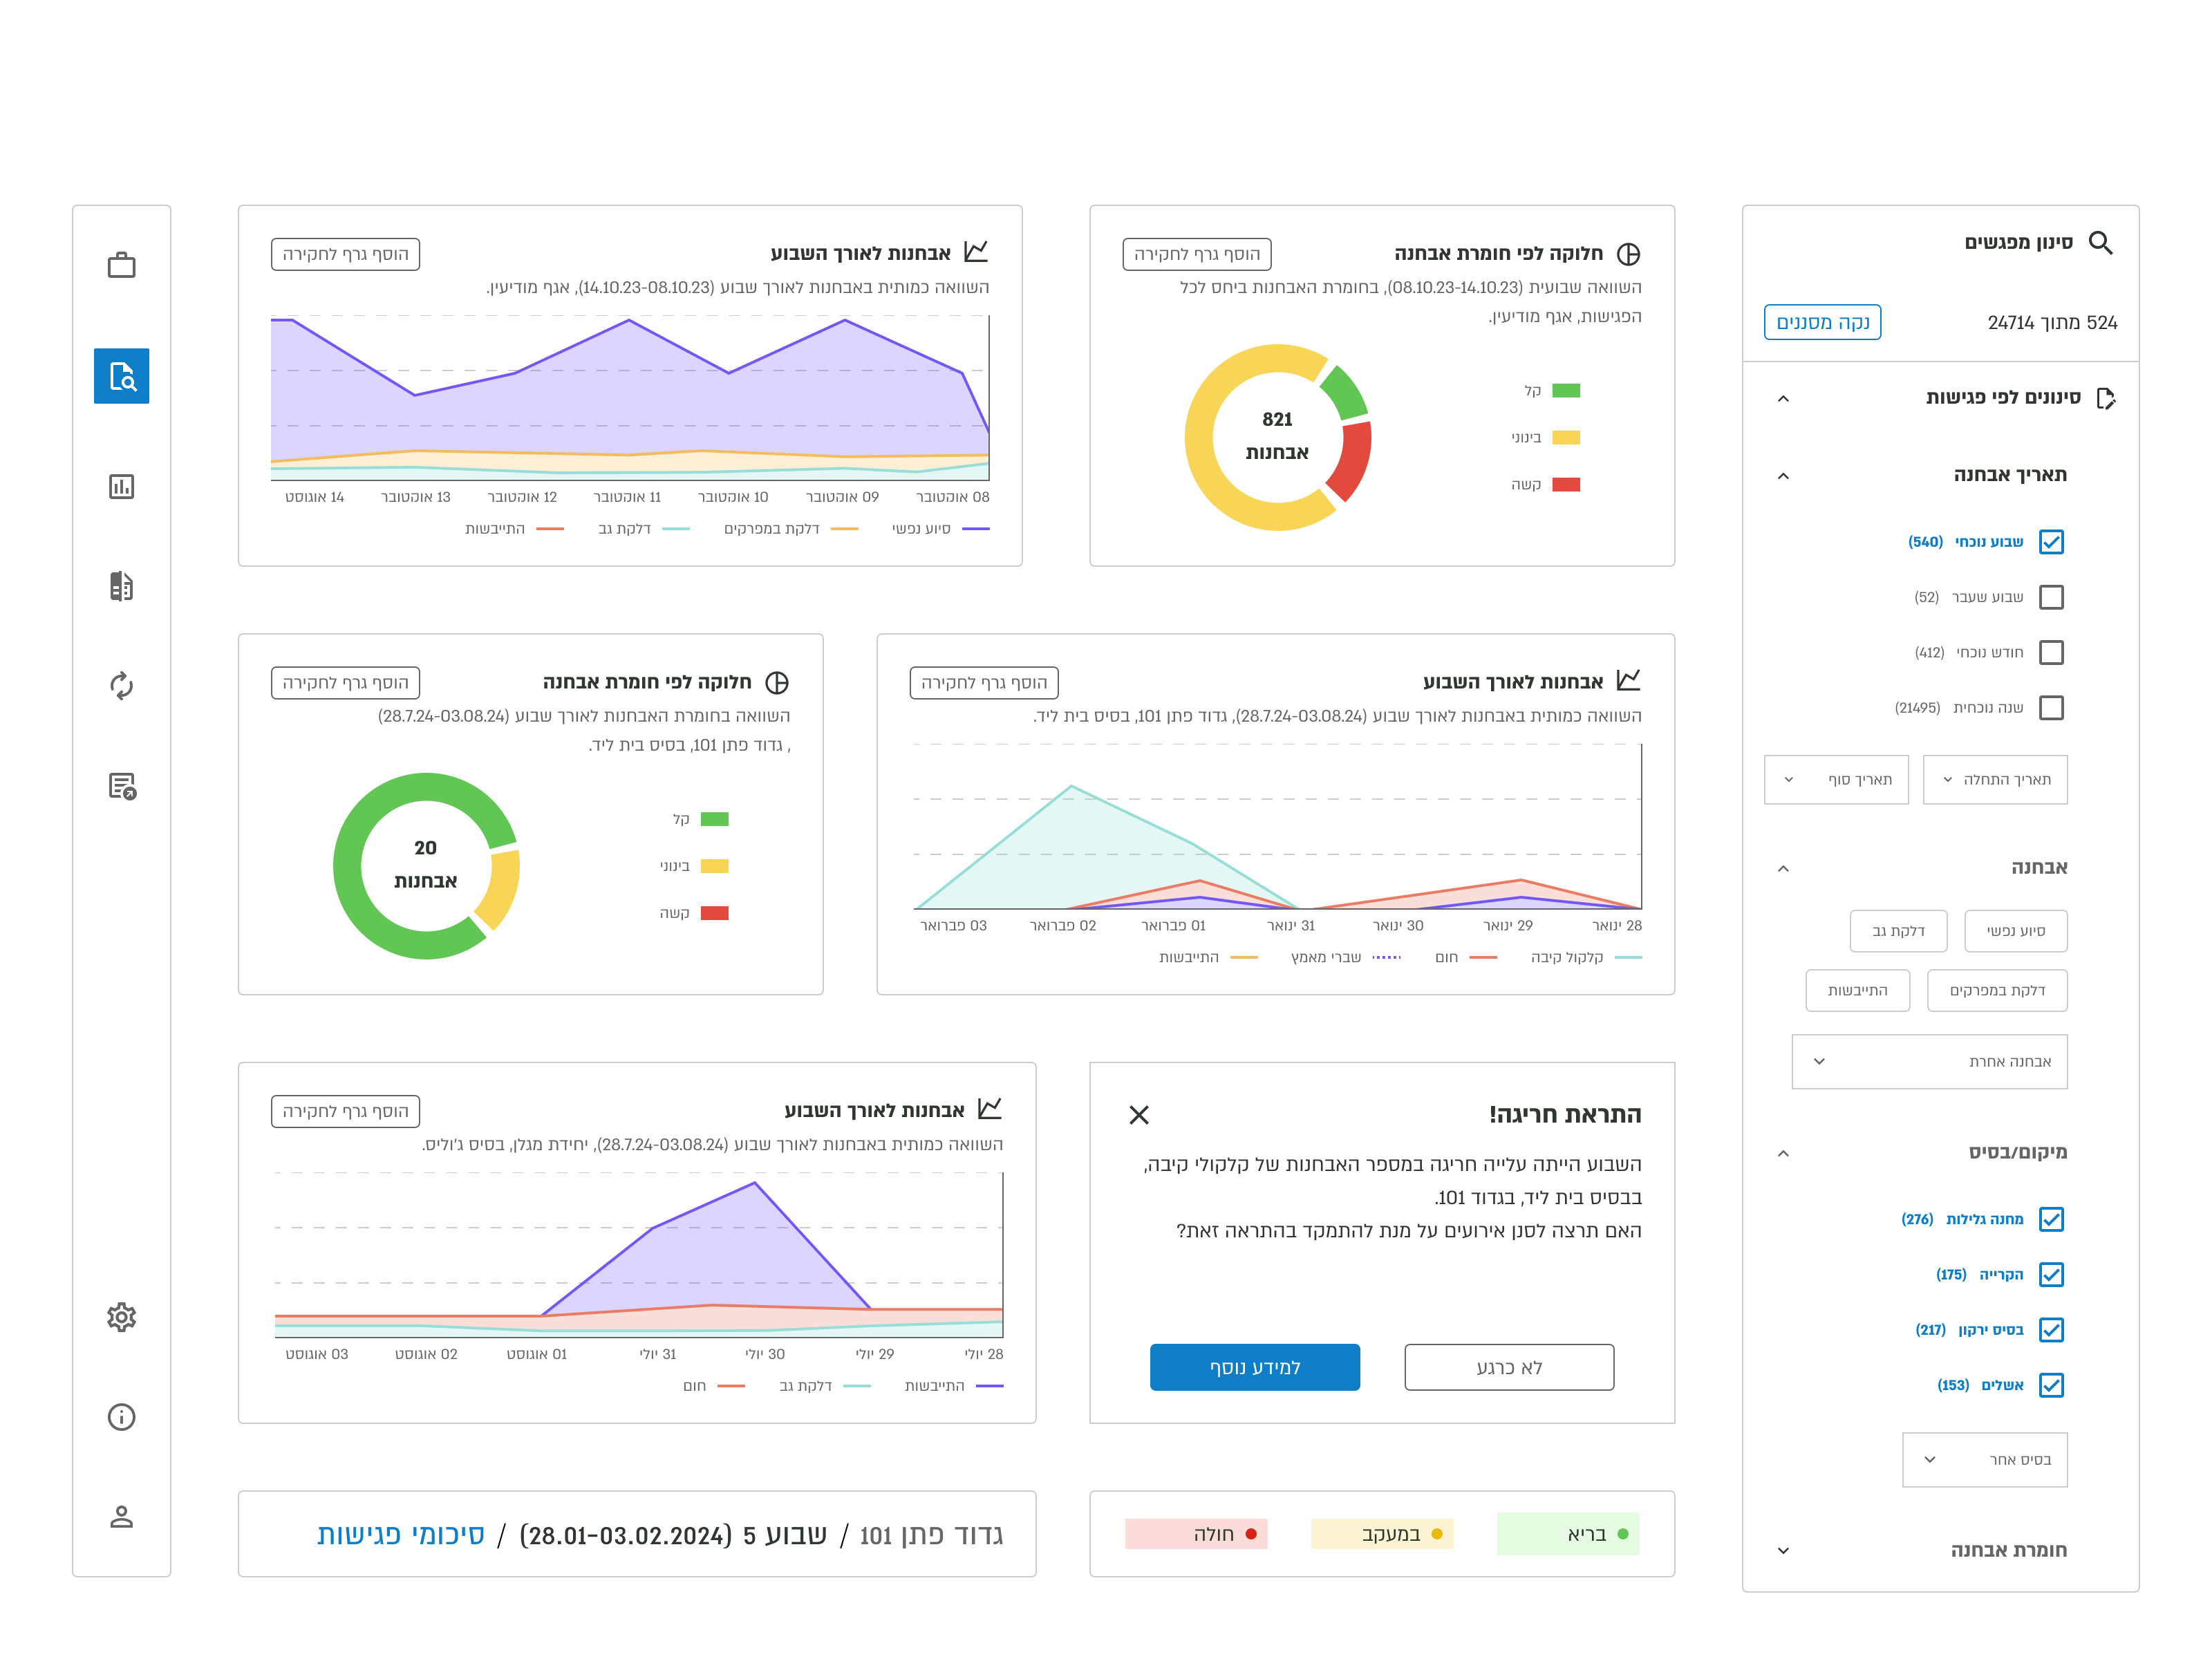
Visual Assets and Graphs Across Various Data Sets